« Where in Colombia does U.S. military aid go? | Main | Uribe on Chávez on FOX News »
September 20, 2006
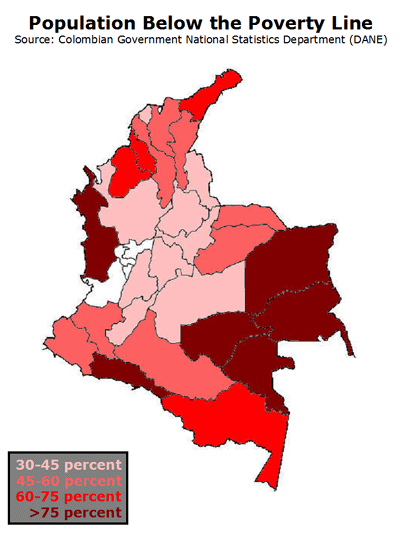
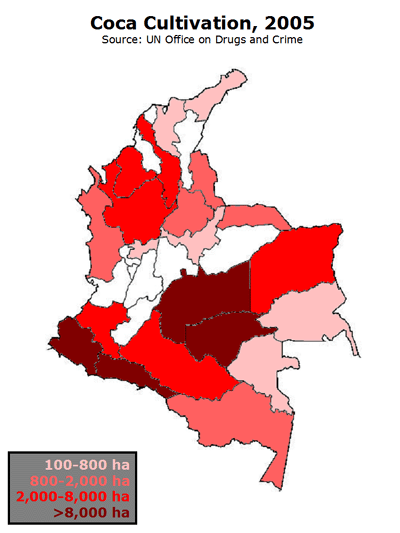
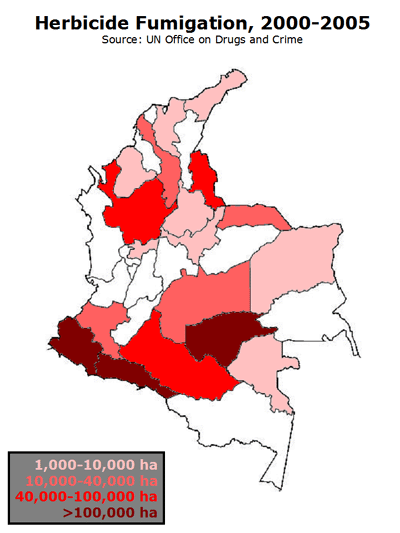
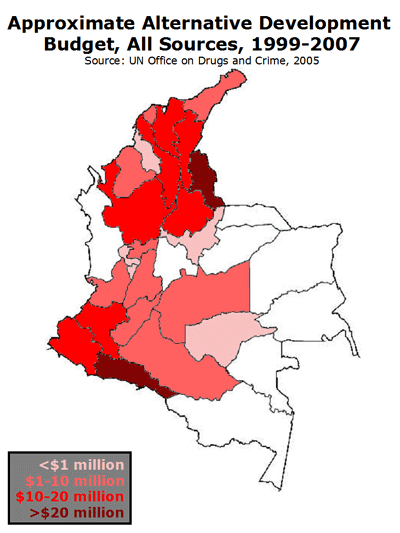
Maps of poverty, coca, fumigation and alternative development
In a conversation today, a House staffer preparing for tomorrow's Colombia hearing asked, "wouldn't it be nice to see the following information side-by-side on a map?"
Yes, it would. Here are four graphics showing poverty levels, coca-growing, fumigation and alternative-development spending by department in Colombia. To see all four on one page, download this PDF file (106KB).


Posted by isacson at September 20, 2006 4:03 PM
Comments
A picture is worth a 1000 words. The poorest areas on the map are not the areas receiving the most development aid.
Posted by: richtiger ![[TypeKey Profile Page]](http://www.ciponline.org/colombia/blog/nav-commenters.gif) at September 20, 2006 5:54 PM
at September 20, 2006 5:54 PM
That's true, richtiger, although those areas that are receiving aid aren't the richest per se either. Then again, the thing is that the *poorest* areas on the map aren't necessarily the areas where most coca is being grown either.
There's certainly a correlation between poverty and coca cultivation, but it isn't a completely direct one. Poverty is one variable, but not the only one.
In the end, the maps can also be used to show that both fumigations (for those that consider them necessary and productive: I clearly don't) and alternative development projects (which I do support) are very far from adequately covering the key areas where poverty and coca cultivation mix.
Posted by: jcg ![[TypeKey Profile Page]](http://www.ciponline.org/colombia/blog/nav-commenters.gif) at September 20, 2006 6:21 PM
at September 20, 2006 6:21 PM
One salient fact is the relative well-being on all maps of the Colombian highlands, including the valleys of the Cauca and the Magdalena. Although correlations-as jcg indicates-are not exact, the area is less poor yet receives more than its "share" of development aid.
Posted by: richtiger ![[TypeKey Profile Page]](http://www.ciponline.org/colombia/blog/nav-commenters.gif) at September 20, 2006 11:21 PM
at September 20, 2006 11:21 PM
Thanks Adam for making this valuable comparison easily available.
Before jumping to jcg's conclusion that "alternative development projects are very far from adequately covering key areas where poverty and coca mix," I would also be interested in seeing a map of population density alongside these other maps. It seems to me that many of the poorest departments are also departments with a VERY low population density (jungles, etc.)--something important to take into consideration when defining what is a "key area."
Interesting to see on the AD map that Caqueta is receving a *comparatively* significant amount of development aid, contrary to all the hubub.
PS-With respect to your penultimate post "Where in Colombia does military aid go?" I'd like to point out that your photo of a blackhawk helicopter parked at an airport in Puerto Asis ("Notes from Putumayo" Aug. 15) would appear to contradict the FOR data that no military aid is going into Putumayo.
Posted by: rainercale ![[TypeKey Profile Page]](http://www.ciponline.org/colombia/blog/nav-commenters.gif) at September 20, 2006 11:59 PM
at September 20, 2006 11:59 PM
Rainer, that conclusion may well sound premature, but I was making it in the context of the maps provided.
I completely agree that "many of the poorest departments are also departments with a VERY low population density".
However, even if the population density involved is quite low, that doesn't change the fact that a proportionally high number of people there are, most likely, going to be involved in the cultivation of drug crops. Going by what the maps here indicate.
Therefore, stating that they definitely need more alternative development alternatives (as redundant as that wording sounds) seems fair to me.
Posted by: jcg ![[TypeKey Profile Page]](http://www.ciponline.org/colombia/blog/nav-commenters.gif) at September 21, 2006 11:39 AM
at September 21, 2006 11:39 AM
Post a comment
Thanks for signing in, . Now you can comment. (sign out)
(If you haven't left a comment here before, you may need to be approved by the site owner before your comment will appear. Until then, it won't appear on the entry. Thanks for waiting.)